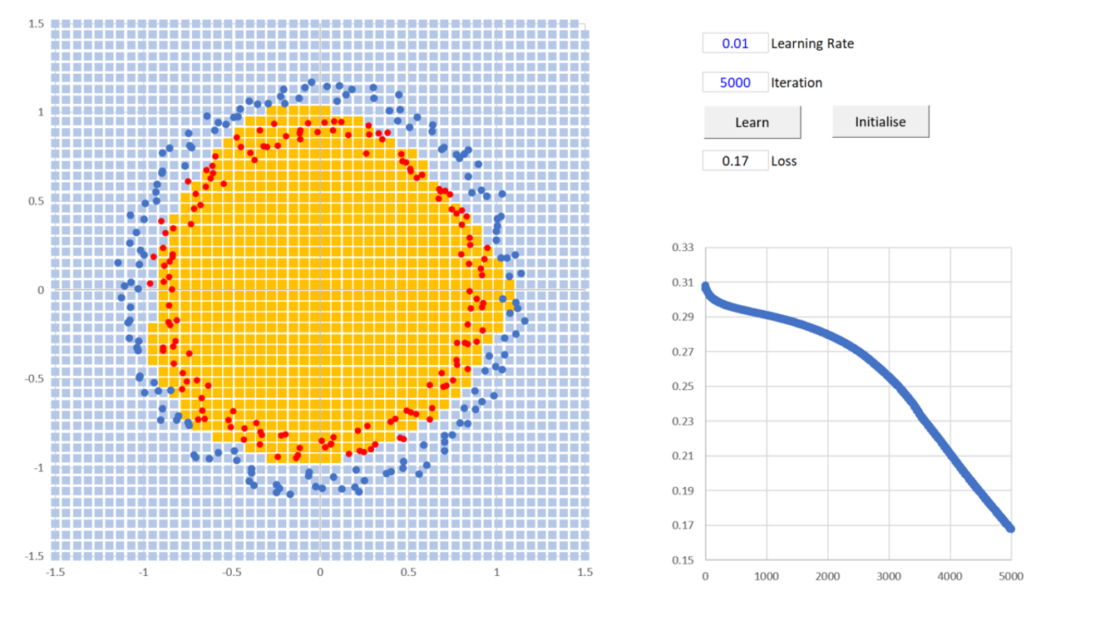
Neural Networks in Excel – Finding Andrew Ng’s Hidden Circle
I’m currently re-tooling as a data scientist and am halfway through Andrew Ng’s brilliant course on Deep learning in Coursera. I’m a spreadsheet jockey and have been working with Excel for years, but this course is in Python, the lingua franca for deep learning. Hence, I found myself struggling not only with the new concepts associated with the subject, but also the syntax of Python – agony.
The first programming assignment of Andrew’s second course “Improving Deep Neural Networks: Hyperparameter tuning, Regularization and Optimization” was to build a basic neural network to identify a function that would separate a scatter of red and blue dots based on their X, Y coordinates. For a human this is simple, the red dots formed a circle inside the black dots with a bit of random scatter but for an algorithm in Excel, well, before Andrew’s course it was not so easy.
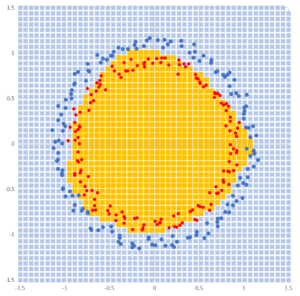
The assignment required the Neural Network to find a boundary between red and black dots. This diagram shows the neural nets final output as shaded orange & blue areas.I had struggled to visualise what was happening inside the neural network and desperately wanted to see something in ‘my’ language, Excel. I searched the net for examples and came up with nothing other than some single neuron examples and one rough MNIST digit classifier. This didn’t make sense to me as I would have thought that Excel was an ideal teaching medium; lots of native speakers and a 2D layout ideal for exploring the dimensions of the inner hidden layers.
Could Excel expose the mystery of Neural Networks?
So, one sunny afternoon at home in India, I set off on a mission. The first step was to grab Andrew’s Data – nightmare, I couldn’t lift it out of Python, I was illiterate. After 2 futile hours, I did the obvious and constructed it myself. This took 5 minutes and opened the possibility of interesting patterns, say a doughnut or a letter. With the data in hand I began construction under the assumption that at some point I’d encounter insurmountable barriers on the way, but to my delight, there weren’t any. After a couple of hours, and with some luck, I’d built it and was ready to start the iterations and learn the function. I hit the macro button, watched for a while, however, nothing happened, I restarted a few times, checked the code then headed off for a coffee. Now the joy of a neural network is that it programs itself which in Excel takes luck and time. I came back a couple of hours later. Wow! I had iterating patterns and a learning curve that was headed in the right direction. The slow speed of my code was, to some extent, a plus and allowed me to see the function develop and ultimately segregate the dots. With the spreadsheet working and through the process of building it, the mystery of basic neural networks and back-propagation was finally clear and exposed.
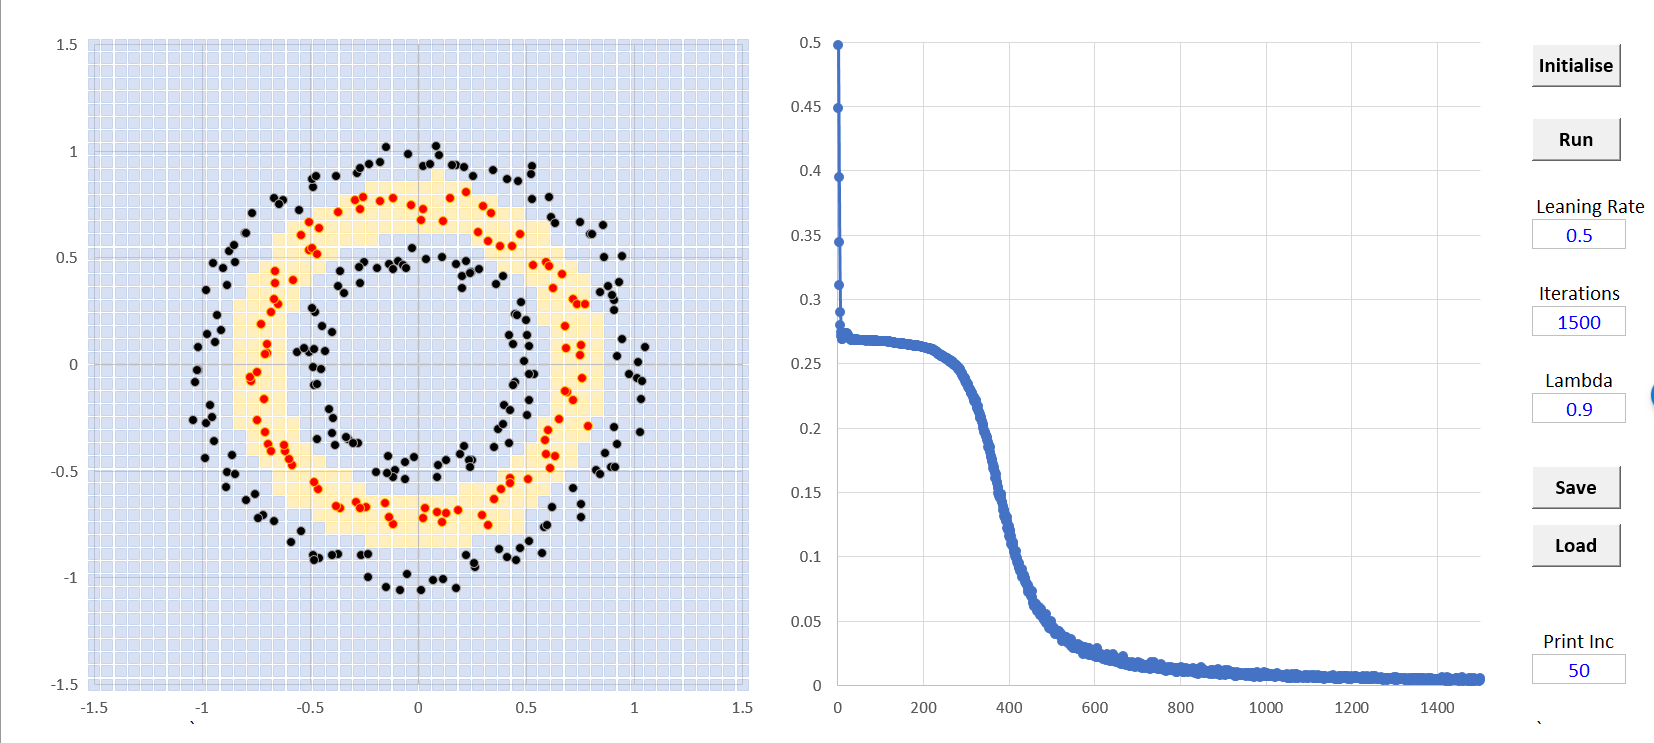
The learning curve drops off at 400 iterations and by 1000 the neural network as learnt and represented the hidden function.
The first model was very slow but Andrew was covering momentum and regularisation that week in his course so I plugged the first in and attempted the second, regularisation, by making the random scatter change each iteration, this was probably more like data augmentation but it was all new to me. My thinking was that the base function behind the data was three circles and re-running the scatter on each iteration would help the model learn this underlying function rather than the training set – I got a huge increase in speed and some fascinating results on the boundary diagram.
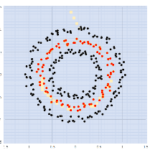
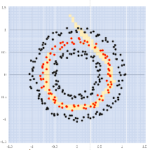
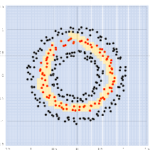
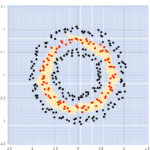
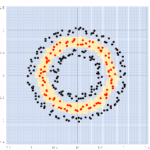
During the learning process (left to right) the boundary function shows weird patterns as it closes in on the red dots.
The Neural Net architecture and equations were more or less straight out of Andrew’s course but placed into an Excel sheet. The layout shown below is very much orientated towards an Excel instantiation, it allowed me to update the model’s Weights and Momentum in a single line of VBA for each iteration namely: Parameters (T) = Parameters (T+1) .value. I subsequently built a fully recursive version with no VBA that made use of Excels inbuilt iteration functionality but this is less satisfying to run.
You can view a video of the model in operation here: https://www.youtube.com/watch?v=mIpJu-I13cc
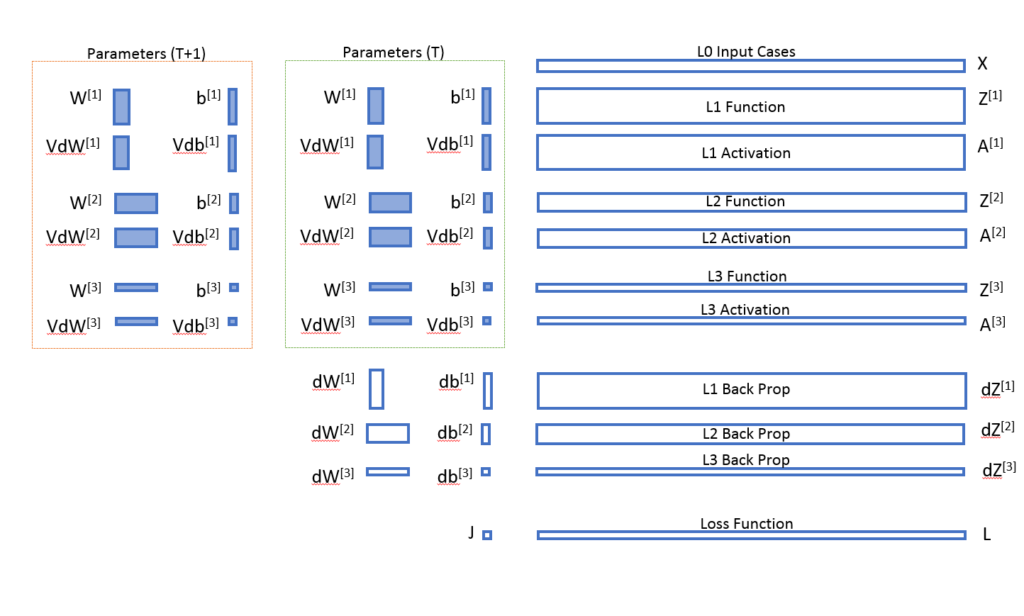
This is the basic layout of the on-sheet Excel. It required approximately 30 separate excel formula
The boundary plot i.e. the orange and blue pixels that cover the X plot and represent the boundary function discovered by the neural network required a second neural net without back propagation (the learning bit) that looks as follows:
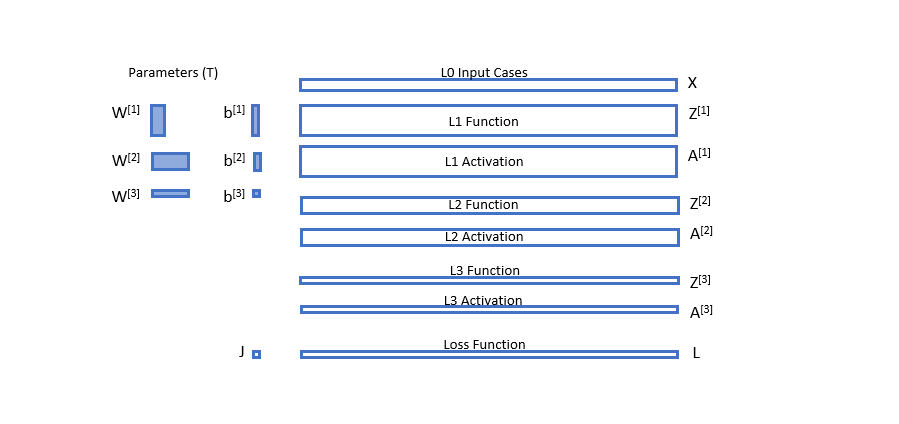
The Neural network used for the boundary function was even simpler with only 8 separate formulae.
I subsequently recorded a construction video which runs for over an hour but gives a lot more detail on the Excel needed to get this up and running. You can view the video here: https://www.youtube.com/watch?v=suZhX6N5LAk&t=3042s
You can download the Excel file here: Download Excel
These videos and associated material if released are available to you under a Creative Commons Attribution-NonCommercial 4.0 International Licence the details of which can be found here: https://creativecommons.org/licenses/by-nc/4.0/legalcode


Watermann
August 3, 2018 at 12:29 pmImpressive work.
Can I download a copy anywhere?
Would love to learn more about this.
Richard Maddison
September 13, 2018 at 6:47 pmHi Waterman,
Sorry, I missed your comment. Are you still interested in the file? If so I’d be happy to email you a copy of the live build from https://www.youtube.com/watch?v=suZhX6N5LAk&t=2476s
Let me know and I’ll send it over.
Richard
audeser
October 20, 2018 at 11:00 pmHi Richard
I don’t know others, but I’m really interested… not only for this one, but all the posts you have in your blog. I’m starting with NN, strill trying to figure out how to configure a system. Right now I’m fighting doing huge modifications in a file from youtuber “David Bots” (https://www.youtube.com/user/MRBOTSO), impressive job there, but I disliked (…well not really disliked, but felt trapped with) the initial horizontal configuration of that files, as it did not allow to expand to newer designs.
Hope you can email files, I’m suscribed to your channel and really enjoy your work.
By the way, I have a blog on wordpress (audeser –> wordpress) dealing with Excel, not very promissing what it’s posted right now (it’s in perpetual modification to finish the posts), but will be nice when any finished. At least I’ll try to focus on the one dealing with games and the one dealing with CAD.
Kind regards, Enrique Luengo
Richard Maddison
January 1, 2019 at 9:11 pmHi Enrique,
Great to hear from a fellow Excel fan. I have a lot more on my YouTube channel https://www.youtube.com/channel/UC44Q4IXVrU6qUtezNU9X_Uw?view_as=subscriber all relating to Neural Networks in Excel. I’ll also be posting what I think is the first Capsule Net NMIST digit classifier in Excel this week – I just managed to fix the final bugs on the 31st Dec but now have the task of writing about it.
Best wishes,
Richard
Wilfredo
September 27, 2018 at 8:58 amExcelente work.
Could you please share your work with me? it ‘s for learning.
Selmer
September 29, 2018 at 6:29 pmHi Richard
Could you share me the copy of the excel. i would love to learn more
email: nedlloyd2007@gmail.com
Marcus Nascimento
October 1, 2018 at 7:44 amHello Richard. Great work. Are you still sending the excel file over email? If so, mine is on the comment.
Thanks
Richard Maddison
January 1, 2019 at 9:14 pmHi Marcus,
Thanks for your encouragement. I’ll be adding a download page to this site in the next week but in the meantime, you can get the original file from the construction Video from my GitHub account https://github.com/RichardMaddison/Excel-3L-FCNN-Andrew-Ng-s-Circle
Can you let me know if you’re able to access this? If not I can email it to you.
Best wishes,
Richard
RaaD
October 15, 2018 at 2:41 pmHi Richard,
I am learning about neural networks, and I think yours is a very impressive application.
Could I download the file somehow.
Richard Maddison
January 1, 2019 at 9:13 pmHi there,
Thanks for your encouragement. I’ll be adding a download page to this site in the next week but in the meantime, you can get the original file from the construction Video from my GitHub account https://github.com/RichardMaddison/Excel-3L-FCNN-Andrew-Ng-s-Circle
Can you let me know if you’re able to access this? If not I can email it to you.
Best wishes,
Richard
baris ozkaya
December 2, 2018 at 2:40 amhi Richard
thats a great work and i appreciate it if you could share the excel files you created for neural networks. Thanks a lot
Richard Maddison
January 1, 2019 at 9:03 pmHi Baris,
I have uploaded the original file from the video on Github https://github.com/RichardMaddison/Excel-3L-FCNN-Andrew-Ng-s-Circle
Can you let me know if you’re able to access this? If not I can email it to you.
I’ll also be adding a download page to this site with other models as I clear any remaining bugs.
Best wishes,
Richard
Pierre Paperon
December 20, 2018 at 10:45 pmHi Richard,
I’ll be interested too by your work. Haven’t done to much in that field since 1993 (4Thought at that time used for Target and Glaxo in 60 countries to build predictive models of sales and more specifically identify actionnable levers) and I’ll be glad to run your tool on data sets.
Thanks in advance for the sharing.
Cheers
Pierre
Richard Maddison
January 1, 2019 at 9:01 pmHi Pierre,
That sounds fantastic I’d love to see what you get. I have uploaded the original file on Github https://github.com/RichardMaddison/Excel-3L-FCNN-Andrew-Ng-s-Circle
Can you let me know if you’re able to access this? If not I can email it to you.
I’ll also be adding a download page to this site with other models as I clear any remaining bugs.
Best wishes,
Richard
Charles Powell
April 12, 2020 at 8:32 amGreat post.